VBA Debugging
A bug is a mistake or error in a program that causes it not to work correctly. Debugging is the process of removing and fixing bugs to get a program to function properly. There are different types of bugs that have different causes and solutions. Bugs can be errors, mistakes, oversights, or poorly implemented logic. Some bugs are easy to detect and fix while others are difficult to recognize and rectify. A bug will ultimately cause a compile error, a runtime error, or an incorrect result.
Compile Errors
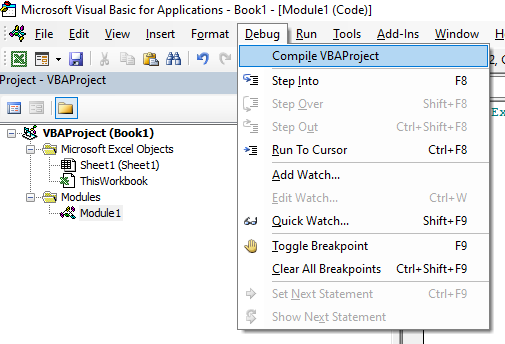
Compile Errors occur at compile-time when a language rule has been broken. A program will not run if it has an error in compilation. To detect compile errors use Debug → Compile VBAProject on the toolbar in the Visual Basic Editor. Using Debug → Compile will compile the code in all modules and raise an error message if there is a compile error anywhere, whereas running a procedure in one module may not show the compile error in another procedure or module.
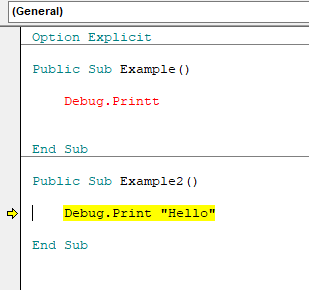
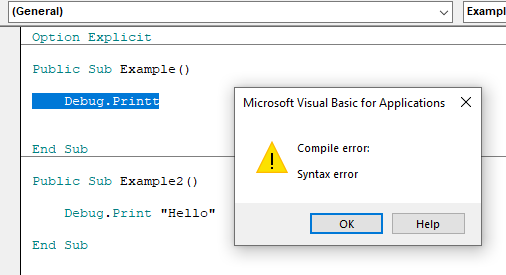
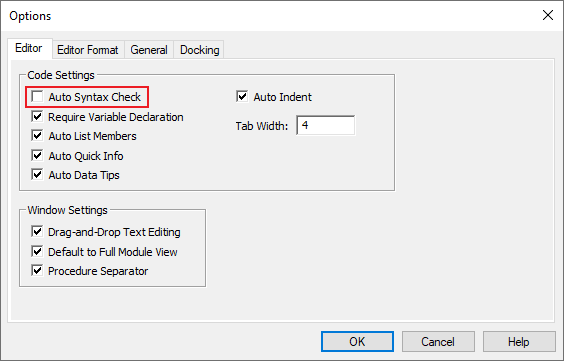
Syntax Errors are compile errors that occur because a syntax rule has been broken. Syntax is the structure of a language and determines what is considered a valid statement. By default, Auto Syntax Check is enabled and the Visual Basic Editor will alert syntax errors and certain other compile errors and highlight them red. If auto syntax check is disabled, pop-up messages will not appear but syntax errors will still appear in red. To enable or disable auto syntax check go to Tools → Options → Editor → Code Settings → Auto syntax check.
Unhandled Runtime Errors
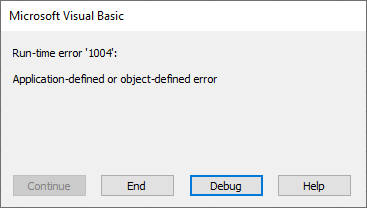
Runtime Errors occur while a program is running. Unhandled runtime errors will cause program execution to pause and a message will be displayed. The user can either press End to end execution of the program or press Debug to open the Visual Basic Editor and view the line of code that caused the runtime error. Runtime errors can be handled using the On Error statement which is discussed in the Error Handling section.
Logical Errors
Bugs which cause incorrect output can be the trickiest to debug because the code can appear to work properly under the right conditions but then work incorrectly under other conditions. These silent logical errors are usually caused by poorly thought-out or poorly implemented logic or overlooking aspects of a problem or solution. This type of bug can often be caught through testing and reviewing the output of the code.
Public Function RandomLong(MinValue As Long, MaxValue As Long) As Long

    'BAD CODE - If MinValue > MaxValue erroneous results occur

    Randomize
    RandomLong = Int((MaxValue - MinValue + 1) * Rnd + MinValue)

End Function
Public Function RandomLong(MinValue As Long, MaxValue As Long) As Long
'FIXED - Unacceptable state causes a runtime error instead of returning wrong answers
If MinValue > MaxValue Then
Err.Raise 5
End If
Randomize
RandomLong = Int((MaxValue - MinValue + 1) * Rnd + MinValue)
End FunctionA runtime error could exist within a silent error if it only occurs under specific conditions. Code may run normally under normal conditions but then break when an edge case is encountered, causing an unhandled runtime error which can leave a program or associated data in an intermediate state.
Debug Object
The Debug object contains two methods which assist in debugging VBA code, Print and Assert. The Debug object has a default global instance and cannot be instantiated. The Debug object can be accessed at any time in VBA just by typing Debug.
Debug.Print
Debug.Print is used to print text to the Immediate Window.
Public Sub Example()

    Debug.Print "Hello, World!"

End Sub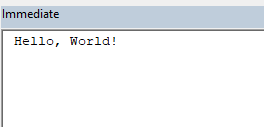
Debug.Assert
Debug.Assert will pause execution if a boolean expression does not evaluate to True. If the expression evaluates to False or Null execution will be paused.
Public Sub Example()

    Debug.Assert 1 > 0
    Debug.Assert True
    Debug.Assert 1

    Debug.Assert 1 < 0  'Pauses Execution
    Debug.Assert False  'Pauses Execution
    Debug.Assert 0      'Pauses Execution
    Debug.Assert Null   'Pauses Execution

End Sub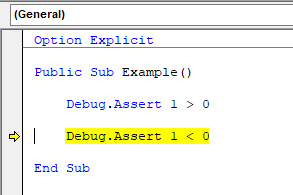
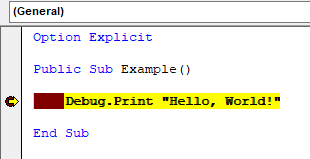
Pause Program Execution
There are a number of ways to cause a program to pause execution and allow the user to inspect the state of a program in break mode.
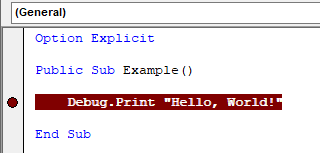
Breakpoints
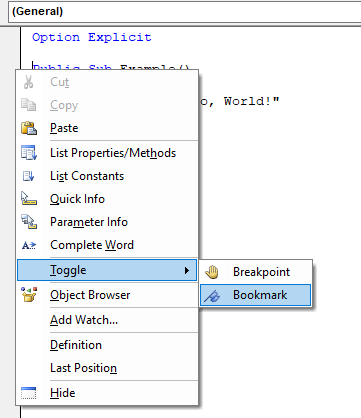
Breakpoints can be used in the Visual Basic Editor to pause program execution when a particular line of code is reached. Execution will pause before the line of code is executed. Breakpoints can be toggled by clicking in the margin next to the line of code, right-clicking the line of code and selecting Toggle → Breakpoint, or by using the Edit or Debug toolbars.
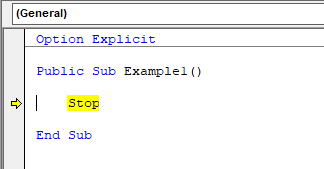
Stop Statement
The Stop statement will pause execution when the keyword is encountered in the code.
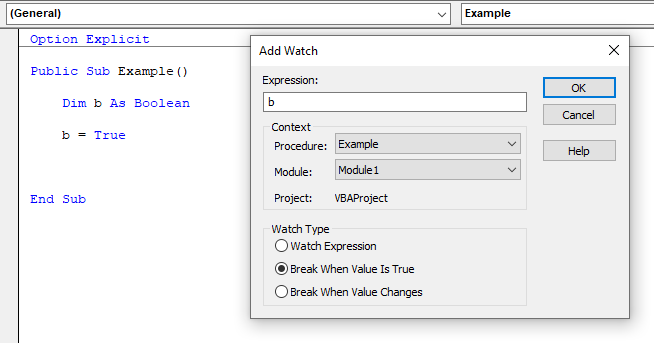
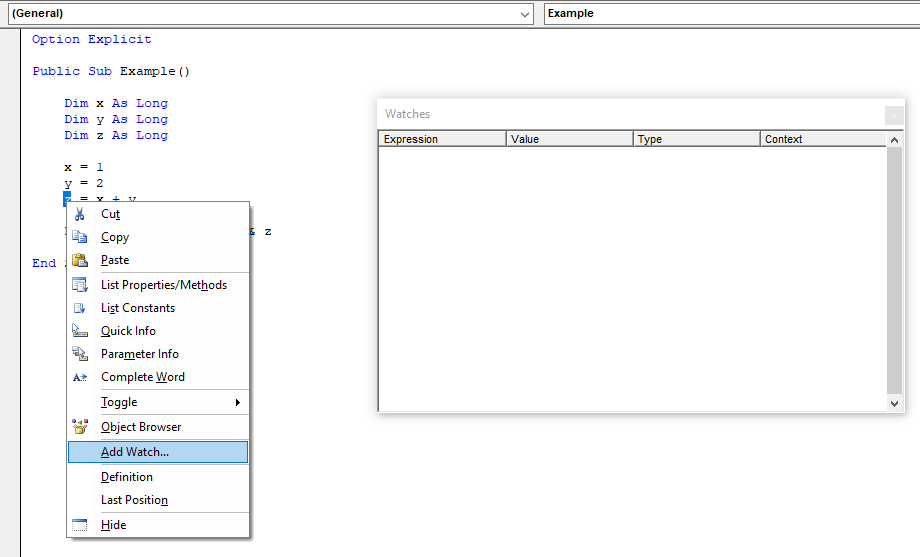
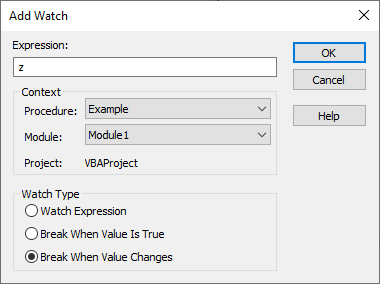
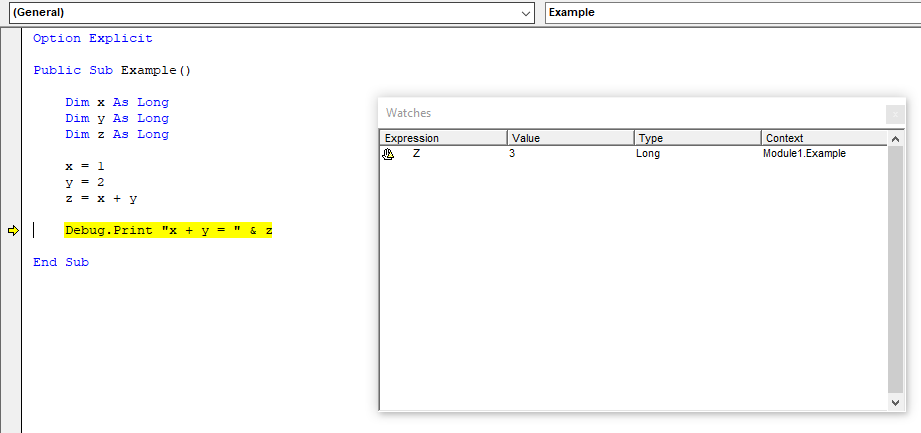
Watches
Watches can be used to pause execution when an expression evaluates to True or when the value of an expression changes.
Runtime Errors
By default, when an unhandled runtime error is encountered a message will appear describing the error, giving the option to End program execution or to Debug. Selecting Debug will jump to the line of code that caused the error and leave program execution paused.
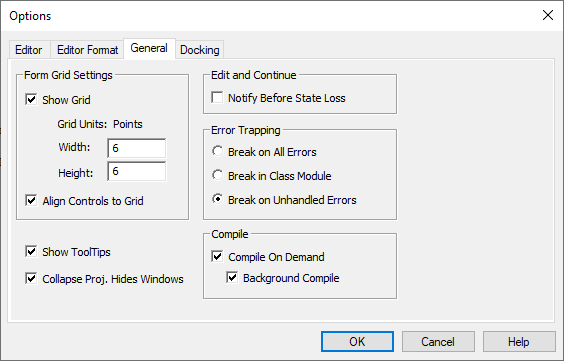
Different error trapping options can be selected to pause execution on all errors or to pause on errors inside class modules.
| Error Trapping Option | Description |
|---|---|
| Break on All Errors | Will enter break mode when any error is encountered regardless of error handling code. |
| Break in Class Module | Will enter break mode and show error inside class modules. |
| Break on Unhandled Errors | This is the default setting. Will enter break mode when an unhandled runtime error occurs. |
Debug.Assert
Debug.Assert will cause execution to pause if a boolean expression does not evaluate to True. If the expression evaluates to False or Null execution will pause.
Public Sub Example()

    Debug.Assert 1 = 0
    Debug.Assert False
    Debug.Assert 0
    Debug.Assert Null

End Sub
Stepping Through Code
There are tools in the Visual Basic Editor for stepping through code which allow developers to take a close look at the way a program executes each line of code. There is: Step Into, Step Over, Step Out, and Run To Cursor. These tools can be accessed from the Debug Toolbar or by using keyboard shortcuts.
| Tool | Shortcut | Description |
|---|---|---|
| Step Into | F8 | Executes a line of code and enters into procedures. |
| Step Over | Shift + F8 | Executes a line of code but will not enter procedures. |
| Step Out | Ctrl + Shift + F8 | Executes all lines of code within a procedure. |
| Run to Cursor | Ctrl + F8 | Executes all lines of code up to where the cursor is currently located. |
Navigating Code
Navigating code is an important skill for programming as well as debugging. When a project grows it becomes more complicated to navigate the code. The Visual Basic Editor provides tools that facilitate navigating code.
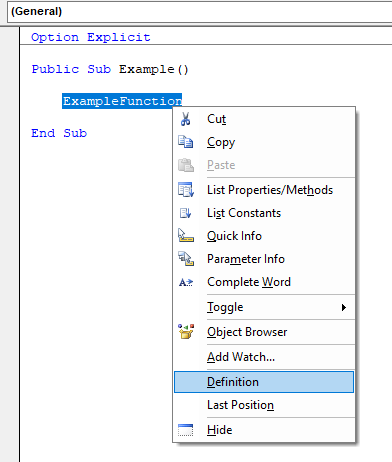
Definition Shortcut
The Definition shortcut allows the developer to jump directly to a where a variable or procedure is defined. To jump to the definition of a variable or procedure right-click on the identifier and select Definition from the right-click menu or use the keyboard shortcut Shift + F2.
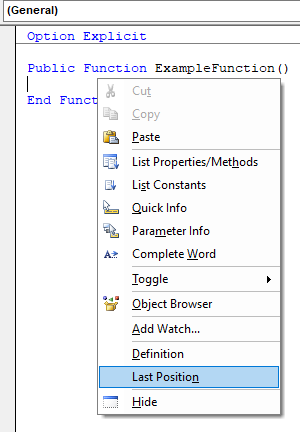
LastPosition Shortcut
The LastPosition shortcut allows the developer to jump to the position in code they last edited. To jump to the last position right-click in the Visual Basic Editor and select LastPosition or use the keyboard shortcut Ctrl + Shift + F2.
Bookmarks
Bookmarks can be used to explicitly set positions in the code that can be cycled through. To set a Bookmark right-click on the line of code and select Toggle → Bookmark. To cycle through Bookmarks, use the Edit Toolbar.
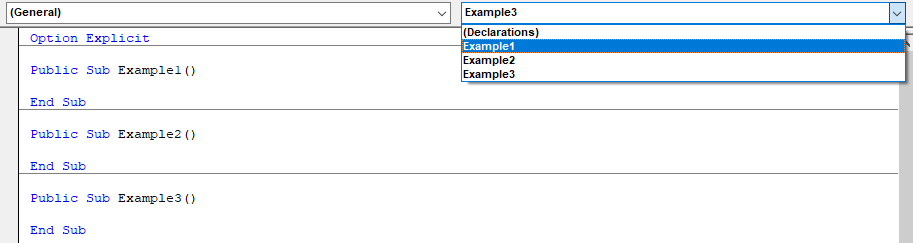
Object Box and Procedure Box
The object box and procedure box drop-downs allow a developer to view all the objects and procedures in a module and jump directly to specific procedures as well as insert event procedures if applicable. The object box and procedure box are located at the top of the coding window. The object box is on the left and the procedure box is on the right.
Split Code Window
The code window can be split so different parts of the same code window can be viewed simultaneously. To split the code window drag the handle at the top right corner of the code window.
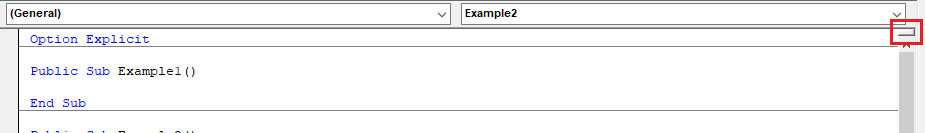
Split code windows view the same code and changes in either window are reflected in both windows.
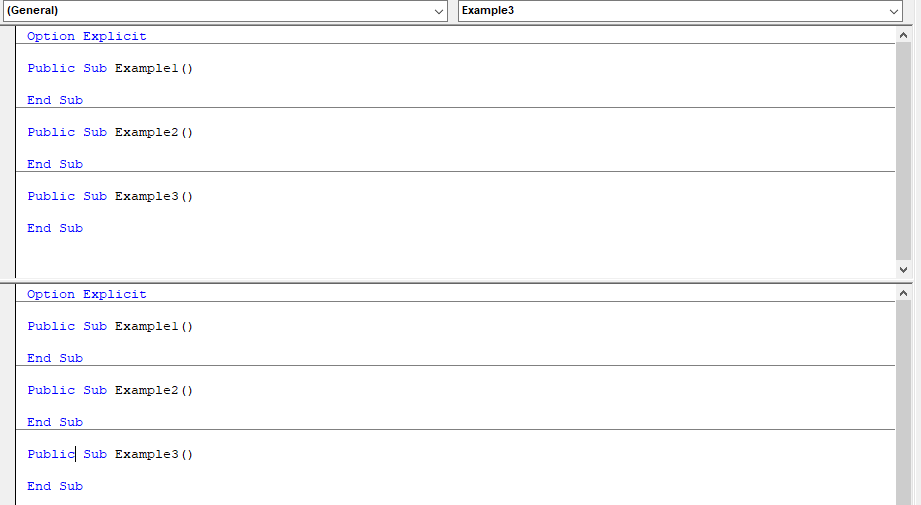
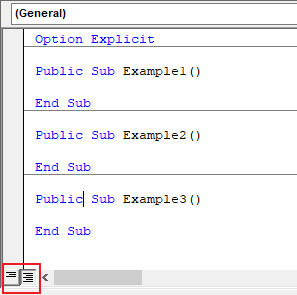
Module And Procedure View
Code windows can be toggled between module view and procedure view. Module view makes the entire module visible in the code window. Procedure view makes only the current procedure visible in the code window. To toggle between module view and procedure view use the toggle buttons at the bottom left corner of the code window.
Useful Shortcuts
| Action | Shortcut | Description |
|---|---|---|
| Intellisense | Ctrl + j | Shows options for completing code |
| Auto-Completion | Ctrl + space | Completes code or shows options for completing code |
| Definition | Shift + F2 | Jumps to where a variable or procedure is defined |
| Last Position | Ctrl + Shift + F2 | Jumps to the last active position in a code module |
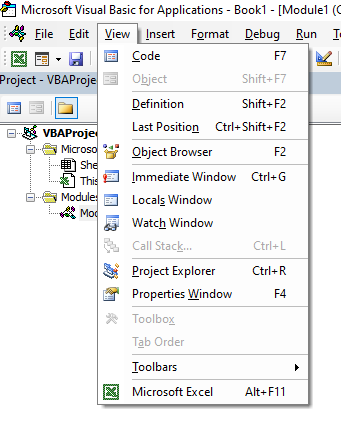
Important Windows
The Immediate Window, Locals Window, and Watch Window are all powerful debugging tools. These windows can be accessed from the View menu in the Visual Basic Editor.
Immediate Window
The Immediate Window can be used to view output, run code, and evaluate expressions. The Immediate Window can be accessed by pressing Ctrl + g in the Visual Basic Editor or from View → Immediate Window.
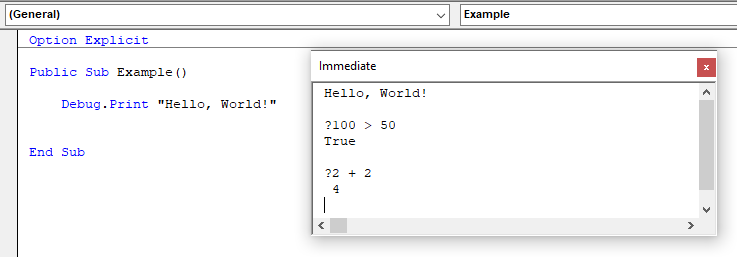
Debug.Print
Debug.Print outputs text to the immediate window. For example, Debug.Print "Hello, World!" will output "Hello, World!" to the immediate window.
Call Procedures
Procedures can be called from the immediate window by typing the name of the procedure followed by any parameters and pressing enter.
Evaluate Expressions Using "?"
To evaluate an expression in the immediate window type a "?" followed by the expression and press enter.
Execute Code Statements
Code can be typed directly in the immediate window and executed. Because only one line can be used in the immediate window to type code, write multiple statement using the ":" statement separator.
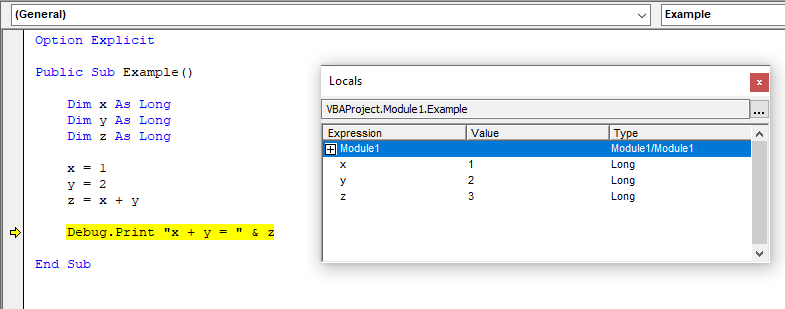
Locals Window
The Locals windows is used to track the values and types of variables during program execution. Pausing execution, stepping through code, and looking at the locals window is an effective way to observe changes in the state of a program. The Locals Window can be accessed from View → Locals Window.
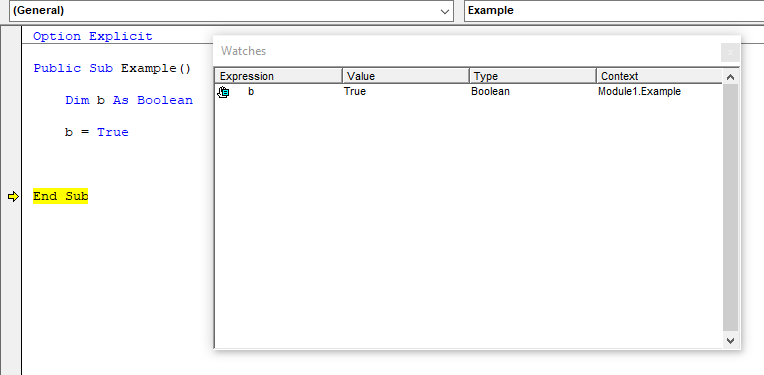
Watches
The Watch Window is used to view how expressions evaluate during a program's execution and to pause execution when certain conditions are reached. To Add a watch, highlight an expression, right-click the expression, and select Add Watch. Alternatively, right-click the Watch Window, select Add Watch, and type the expression. To access the Watch Window navigate to View → Watch Window.
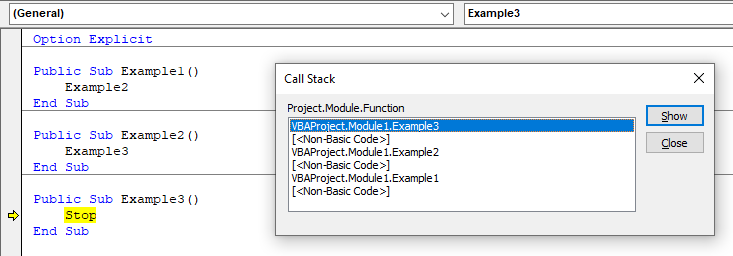
Call Stack Window
The call stack window shows a list of active procedures. To see the call stack dialog either navigate to View → Call Stack, click the call stack icon on the Debug toolbar, or use the shortcut Ctrl + L.